Benchmarking the Warm-Up Performance of HotSpot VM, GraalVM and OpenJ9
—
A Learner's Journey
Published: 9th February 2021; Last updated: 9th February 2021
Contents
Preface
▲Hey there! Are you new to the JVM? Did you just run your Java programs but never cared what the JVM does with your code under the hood? Want to learn about JVM internals, how to (not) write a Java benchmark test or are you simply curious about JVM performance? Then keep on reading!
Join me on my journey into the world of Java microbenchmarking, Just-in-Time compilers and other JVM internals.
This blog post will be about JVM Warm-Up Performance.
Usually warm-up is defined as the number of iterations the JVM needs to increase the speed of method execution between the first and the n-th invocation by applying JIT compiler optimizations to the bytecode.
There exist a range of papers on the subject of JVM warm-up that were published within the last 5 years [1] and the 20 most relevant results all mention that warm-up has to be considered (and also how). However, only one study actually puts a focus on JVM warm-up performance, by designing a new JVM named HotTub [2]. What this study does not focus on, are comparisons of warm-up among existing JVMs.
So I was curious to find out more about JVM warm-up performance. I wanted to know if some JVMs can warm up code faster than others and if so, which one would be the fastest. For sure I couldn't test alle the JVMs out there, so I decided to go for the tried and tested OpenJDK HotSpot VM, the polyglot GraalVM and the enterprise JVM OpenJ9.
Additional remarks:
- JVMs visited in this blog post:
- OpenJDK HotSpot VM [used release]
- GraalVM (CE) [used release]
- OpenJ9 [used release]
- Benchmarks were run for Java 11 LTS versions of the listed JVMs only.
- Benchmark measurements were performed in October/November 2020.
JVM Fundamentals
▲This blog post cannot (and will not) provide a detailed introduction to JVM internals. However, I will (briefly) cover some aspects that are relevant for understanding this article. If something seems unclear to you or you would like to deepen your knowledge, I recommend further readings, e.g. Scott Oaks' Java Performance [3] or watching some of these videos [4],[5]. Whatever you do, don't lose yourself in too many open browser tabs 😉. You've been warned!
Java Heap and Garbage Collection
Memory in the Java heap is managed in generations (memory pools holding objects of different ages). Garbage Collection (GC) occurs in each generation when the generation fills up.
[6] The Java heap is basically divided into young and old generation (permanent generation was removed in JDK 8, now there is metaspace):
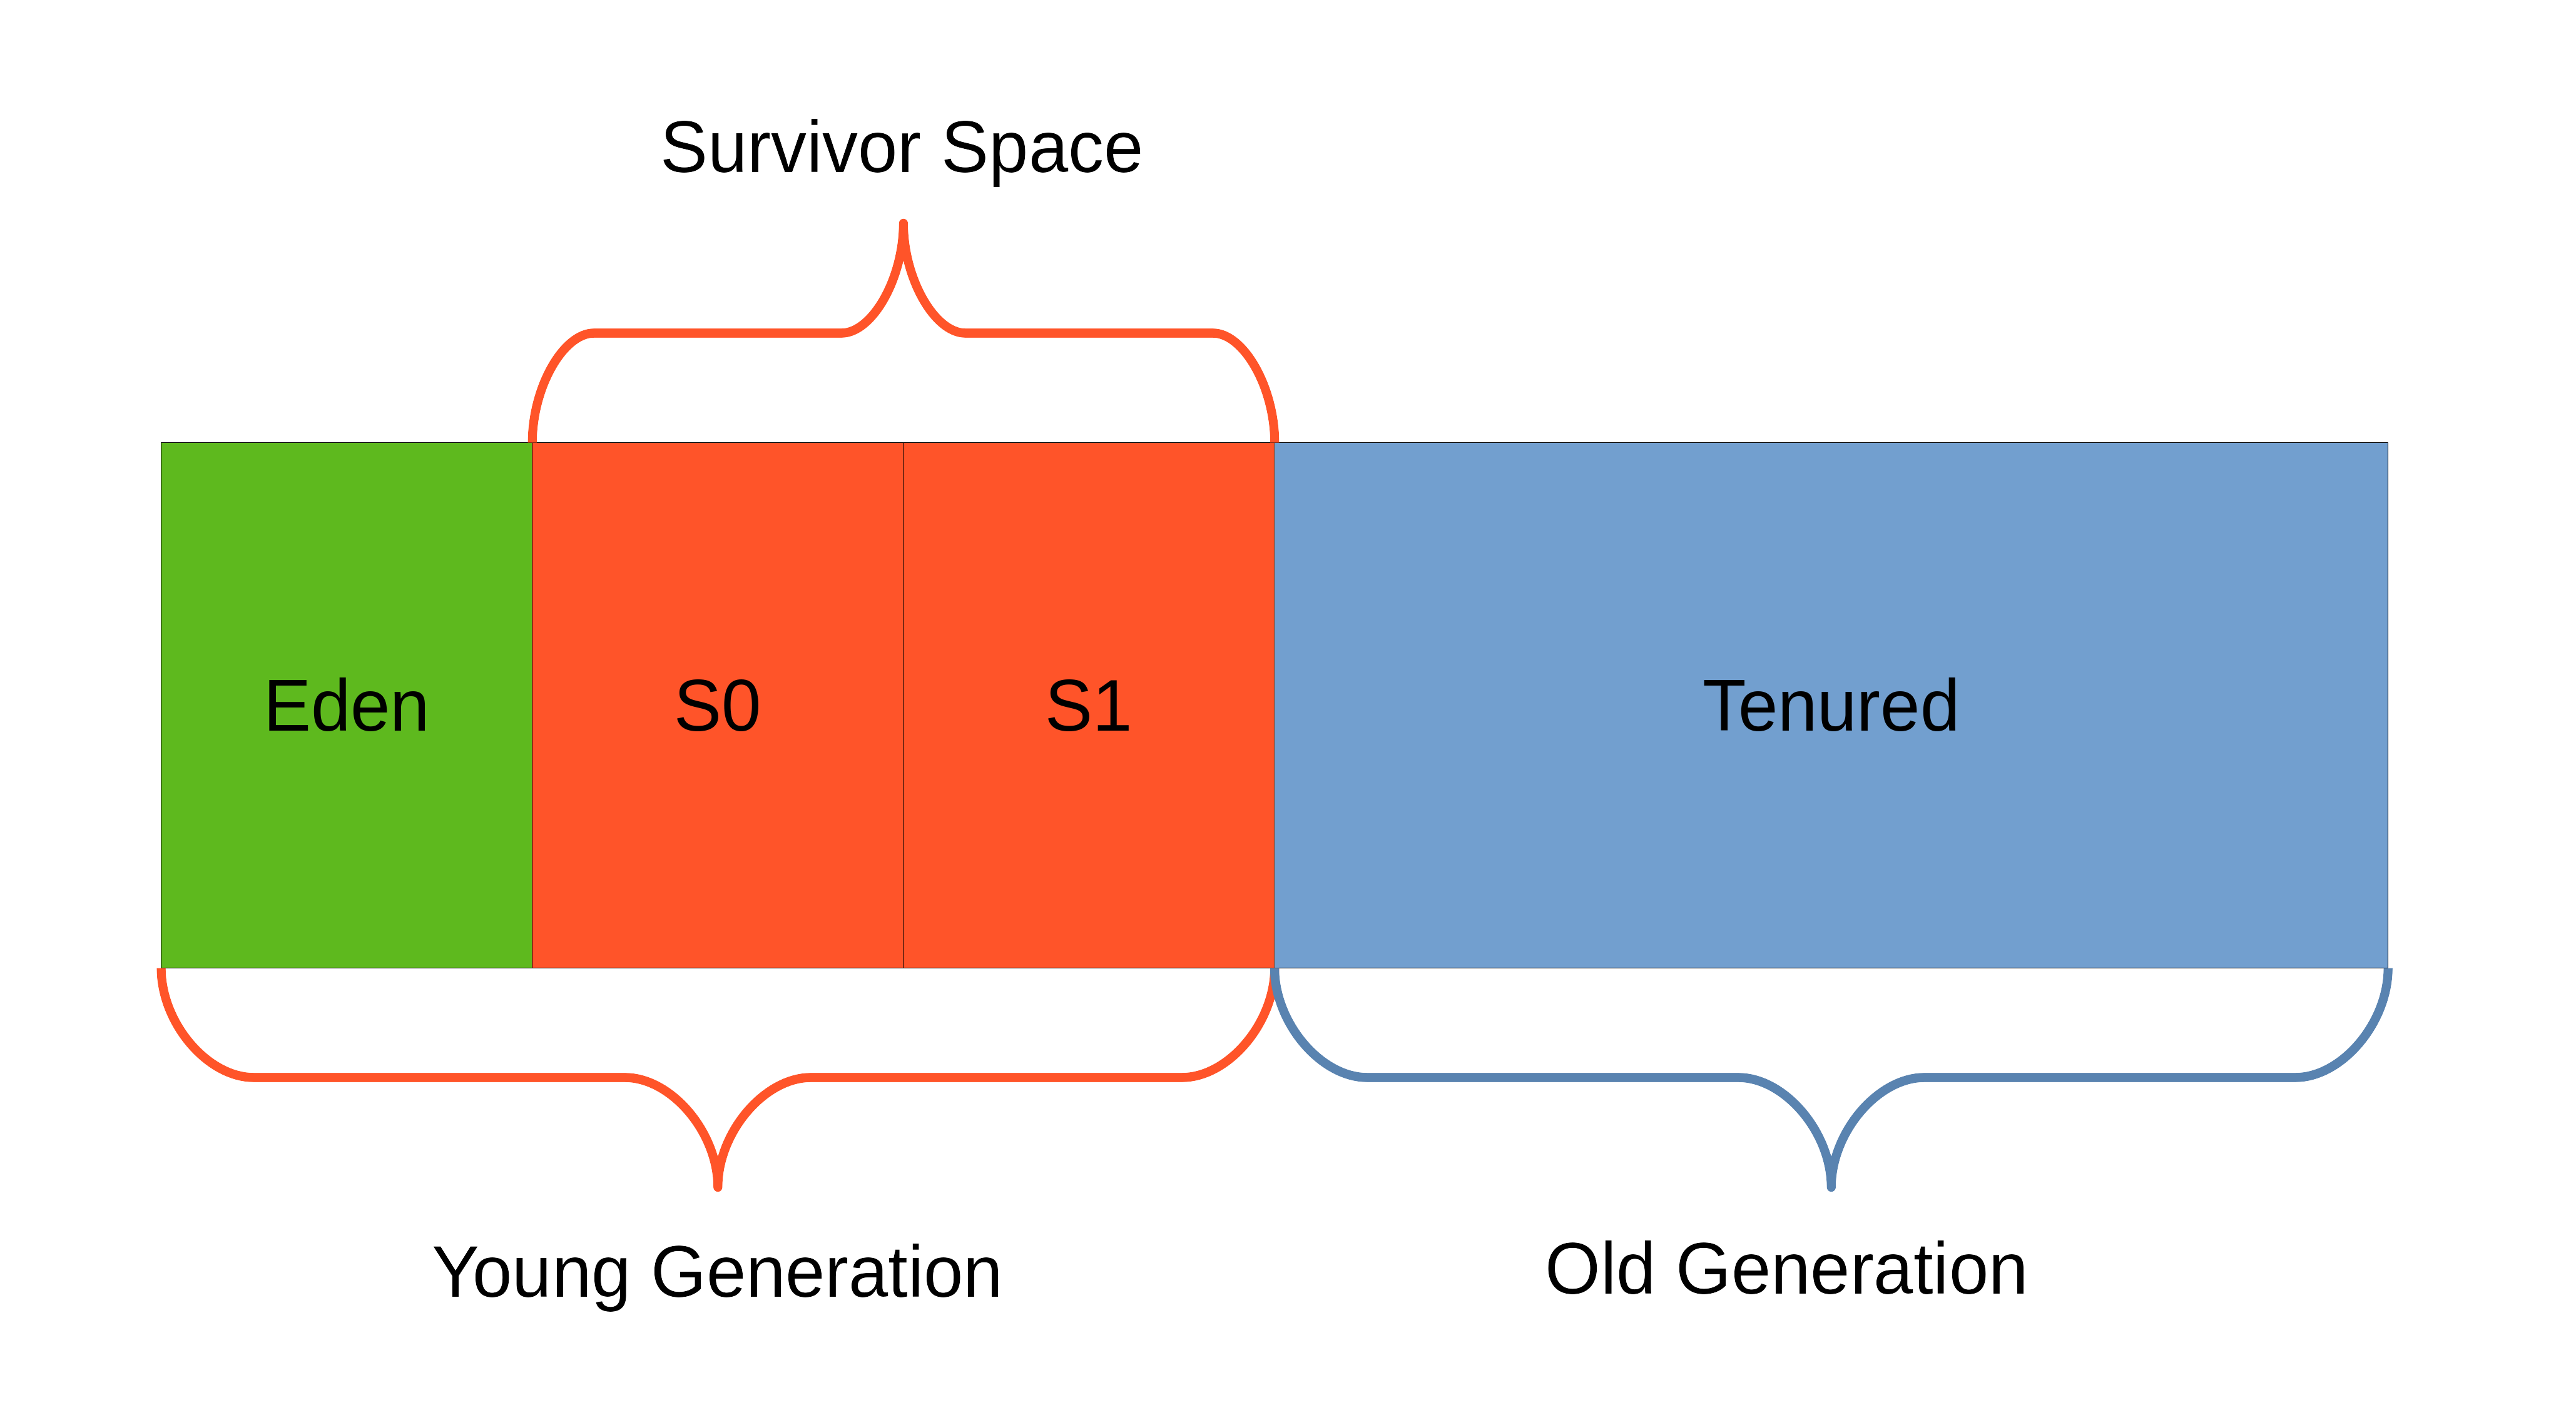
The young generation consists of the Eden space and two Survivor spaces. For newly created objects memory is always allocated in Eden. If the first (minor) GC occurs, all objects that are still referenced will be moved to one of the Survivor spaces. One of them will always be empty. In the next GC cycle the Survivor spaces get swapped. Objects that survive many GC cycles and have been moved between the two Survivor spaces several times, will be transfered into the Tenured space (old generation). This can also happen if there is not enough space left in the Survivor spaces. Major GC cycles can cause the JVM to "stop-the-world", meaning that no new memory is allocated until the GC cycle has finished and with that pausing the entire application.
Up to now, there exist seven Garbage Collection algorithms:
- Serial GC
- Parallel GC
- Concurrent Mark Sweep GC (CMS)
- Garbage First GC (G1)
- Shenandoah GC (JDK 12, but available in many JDK 11 releases)
- ZGC
- Epsilon GC
handles memory allocation but does not implement any actual memory reclamation mechanism. Once the available Java heap is exhausted, the JVM will shut down.[7]
JIT Compilers
The HotSpot VM contains two JIT compilers: C1 (also called client compiler) and C2 (also called server compiler). C1 is designed to run faster and produce less optimized code, while C2, on the other hand, takes a little more time to run but produces a better-optimized code.
[8]
In default configuration, the JVM marks a method as hot after this certain code block was executed more than 10 000 times. Only after that, the C2 server compiler starts to compile the hot code. Once ready, the C1 compiled code is replaced by the C2 compiled code (sometimes C2 compiled code is refered to as level 4 compilations). C1 optimizations (level 1-3 compilations) kick in a lot earlier. The first time, code is executed, it is even only interpreded by the JVM. To learn more about the concept of Tiered Compilation checkout the book I recommended or watch the first few minutes of the mentioned video.
Java Microbenchmarking
▲Writing a good benchmark test is not easy. There are two fault categories: conceptual flaws when designing a microbenchmark and contextual effects when running it. Let's neglect the contextual effects for now. I'll cover that when I write about the test environment. Conceptual flaws however can mostly be avoided by using frameworks that prevent many issues by design or at least provide methods to circumvent common pitfalls. The following chapter will introduce such a tool.
Java Microbenchmark Harness
The Java Microbenchmark Harness [9] (JMH) is a tool that was created with the intention to help developers in avoiding common pitfalls when writing and executing Java benchmarks.
JMH provides four different benchmark modes: (i) Throughput, (ii) AverageTime, (iii) SampleTime and (iv) SingleShotTime.
While (i) measures the number of operations per second and (ii) & (iii) give information about average execution time, lower and upper bounds, etc., the (iv) SingleShotTime mode measures the duration for a single benchmark method execution. This is useful to test how things perform under a cold start.
At this point I will introduce a terminology based on terms used by JMH to adequately describe the way a benchmark measurement is carried out:
-
run
- A new measurement series that consists of one or more forks.
- Number of repetitions of a benchmark measurement. With every fork, a new JVM is spawned to make sure the benchmarks run under same pre-conditions, i.e. not accidentally making use of an already warmed-up JVM.
- Number of subsequent executions for a benchmark test.
fork
iteration
The number of forks and iterations can be configured either directly in the code, using the respective annotations, or by providing them through flags on the command line (which would overrule the annotation configuration):
The flags -i 21000 -f 20 -to 360m would instruct JMH to run the benchmark test in 20 independent forks with 21 000 iterations each. The -to flag sets the timeout to 360 minutes. If the current fork doesn't finish within that time frame, it is aborted. With the -wi flag you could adjust the warm-up iterations. However, since I wanted to measure the warm-up itself, I set the number of warm-up iterations to 0 inside the benchmark test code.
The -rf option is used to specify the output format (e.g. -rf json) and should be combined with -rff <filename>.
To view a complete list of JMH command line options invoke the following command:
$ java -jar target/benchmarks.jar -hIf you have several benchmark tests in your project, but want JMH to execute only a single one, you can do so by referencing it via its class name, e.g.:
$ java -jar target/benchmarks.jar MyBenchmark
For further reading I recommend the blog post by Jakob Jenkov [10] which helped me a lot when writing my first benchmark test.
Lessons Learned
Since the community agrees that writing a good benchmark test isn't easy, one might ask: Why making the effort writing a benchmark and not using any existing benchmark suite?
Well I looked for that in first place, but it quickly turned out that existing benchmark suites like SPECjvm2008 or the DaCapo benchmark suite do not fit my research's use case. Neither the outputs and measurement units were in a suitable format that would have allowed further analyzing the collected data, nor all benchmkar tests were working with the targeted Java version 11. In addition, both suites were already quite outdated. SPECjvm2008 was released in 2008 and the DaCapo benchmark suite (first release in 2009) did issue its last maintenance release almost two years ago (which is eight months before the release of JDK 11). I guess I should mention that there seems to be a 2019-snapshot of the DaCapo benchmark suite available which is build with JDK 11, but still I didn't consider DaCapo Bench to be useful in my case.
Under the given circumstances, writing a new benchmark test for evaluating the warm-up performance of Java 11 JVMs was the only reasonable alternative.
I first tried to reuse existing benchmark tests from SPECjvm2008 (compression and crypto benchmarks) and bootstrap them using JMH. I managed to get the benchmark tests running, but finally failed when the benchmark execution either exhausted the available heap (6 GB) or did not finish in a reasonable time window.
This tweet from August 2020 shows my first attempt to write my own Java microbenchmark test. The code generates 100 random integers and divides them into a list of odd or even integers. Then, both lists are sorted and printed to stdout. Soon I learned about the importance of consuming the program's outcome. Otherwise the JVM would detect that the result of the operation is never used and simply not execute the whole method. This is called Dead Code Elimination. Your benchmark would report to have finished in (almost) zero time, since it didn't do anything. To avoid this pitfall, you could implement the method to have a return value, print the processed objects to stdout or use JMH's Blackhole to consume the objects of interest.
For further analysis on the collected data I created some Jupyter notebooks in which I could generate plots from the data. I also wrote a small script to transform the raw output from JMH into a consumable format.
The Final Benchmark Test
Besides the benchmark that is sorting odd and even integers into lists, I experimented with other implementations doing summations or counting some bottles of beer on the wall [11].
In the end, I found that a backtracking algorithm to solve a Sudoku would be a suitable benchmark test, as it is a fine-grained work-based benchmark. The architecture is not too simple so the JVM would not eliminate parts of the benchmark code right away, but it is limited enough to be used for precise microbenchmarking.
The benchmark test can be found on GitHub.
The JMH version used is 1.23.
Warm-Up Performance
▲Enough theory, let's run some code!
Test Environment and Configuration
The benchmark test was executed several times in a virtual environment hosted on a server in Germany (low latency to my location) which has the following specs:
-
Operating system:
- Ubuntu 20.04 LTS 64bit (GNU/Linux 5.4.0-42-generic x86_64)
- 8 vCPUs based on AMD Opteron 63xx 2.4 GHz
- 8 GB (no swap configured)
- 80 GB HDD
CPU:
RAM:
Storage:
-
HotSpot VM:
- OpenJDK 64-Bit Server VM AdoptOpenJDK (build 11.0.8+10, mixed mode)
- OpenJDK 64-Bit Server VM GraalVM CE 20.2.0 (build 11.0.8+10-jvmci-20.2-b03, mixed mode, sharing)
- Eclipse OpenJ9 VM AdoptOpenJDK (build openj9-0.21.0, JRE 11 Linux amd64-64-Bit)
GraalVM:
OpenJ9:
For each JVM, the Sudoku benchmark test was executed with 21 000 iterations over 20 independent forks. All measurements are recorded without discarding any of the data early on. This means that warm-up iterations are included in the measurement results. For evaluation of warm-up speed, having this data is crucial.
I repeated the measurements at different days and daytimes, to ensure that they are not distorted by other operations running on the shared virtual environment during one of the benchmark executions.
In order to have comparable benchmark results among the JVMs I tried to avoid interferences wherever possible. Therefore, I provided the JVMs with a bunch of runtime flags:
-
HotSpot VM:
-
$ java11-hotspot -XX:+HeapDumpOnOutOfMemoryError \
-jar target/benchmarks.jar Backtracking \
-jvmArgs "-Xms5g -Xmx5g -XX:+HeapDumpOnOutOfMemoryError -XX:+UnlockExperimentalVMOptions -XX:+UseEpsilonGC -XX:+AlwaysPreTouch" \
-rf json -rff jmh-result-hotspot-backtracking-sudoku.json \
-i 21000 -f 20 -to 360m \
| tee output-hotspot-backtracking-sudoku-$(date +'%FT%H-%M').log
-
$ java11-graalvm -XX:+HeapDumpOnOutOfMemoryError \
-jar target/benchmarks.jar Backtracking \
-jvmArgs "-Xms5g -Xmx5g -XX:+HeapDumpOnOutOfMemoryError -XX:+UnlockExperimentalVMOptions -Dlibgraal.MaxNewSize=6442450944 -Dlibgraal.PrintGC=true -XX:+AlwaysPreTouch" \
-rf json -rff jmh-result-graalvm-backtracking-sudoku.json \
-i 21000 -f 20 -to 360m \
| tee output-graalvm-backtracking-sudoku-$(date +'%FT%H-%M').log
-
$ java11-openj9 -XX:+HeapDumpOnOutOfMemoryError \
-jar target/benchmarks.jar Backtracking \
-jvmArgs "-Xms5g -Xmx5g -XX:+HeapDumpOnOutOfMemoryError -Xgcpolicy:nogc" \
-rf json -rff jmh-result-openj9-backtracking-sudoku.json \
-i 21000 -f 20 -to 360m \
| tee output-openj9-backtracking-sudoku-$(date +'%FT%H-%M').log
Note:
GraalVM:
OpenJ9:
java11-hotspot, java11-graalvm and java11-openj9 are aliases I configured for each JVM.
The provided runtime flags partially differ in their syntax between the JVMs and not all configurations are available on every JVM. However, by providing a smart combination of different JVM-specific flags, a similar runtime behaviour can be achieved. In particular I decided to entirely disable Garbage Collection and prefetch memory from the operating system to avoid requesting physical memory during runtime. Coupling the -XX:+AlwaysPreTouch option with setting the same value for -Xms and -Xmx, all memory is committed on startup, which avoids latency spikes when the memory is finally used. For further explanations, see appendix below.
Besides the runtime flags mentioned, the JVMs were all used in their default configuration (no adjustments regarding compilers, etc.), as a real user would do. The assumption is that users don't care about configuring their JVM, they just throw their Java code at it and want it to run in an acceptable performance. For GraalVM this means that the GraalVM compiler mode will be libgraal, which is the default mode of operation.
Test Results
The graphs of the warm-up charts visualize the iterations' median values among all forks of all runs of the tested JVMs. Thus, I'll call these graphs median curve. The data points of the first iteration are excluded from the visualization as they include the time taken for lazy class loading. A graph's shade indicates the interquartile range Q1 (25% percentile) to Q3 (75% percentile). The interquartile range will serve to represent the scattering of the different fork's individual data points of any given time slice. Thus, I call them scatter shade. Median and quartiles are used instead of mean and standard deviation, as they are robust to outliers and skewed distributions. The x-axis is labeled with the number of iterations and the y-axis with the time per operation in nanoseconds.
A full list of charts can be found in the appendix.
A single run of the Sudoku benchmark consisting of 20 forks usually finished within less than 10 minutes. One fork with 21 000 iterations took around 45 seconds for HotSpot and GraalVM. For OpenJ9 it took a little longer (1:20min).
These are the average execution times for a single iteration of the benchmark test:
| HotSpot VM | GraalVM | OpenJ9 | OpenJ9 AOT | |
|---|---|---|---|---|
| Avg. Execution Time (in milliseconds) | 0.4142 ms | 0.4087 ms | 0.4983 ms | 0.4501 ms |
Overall Comparison
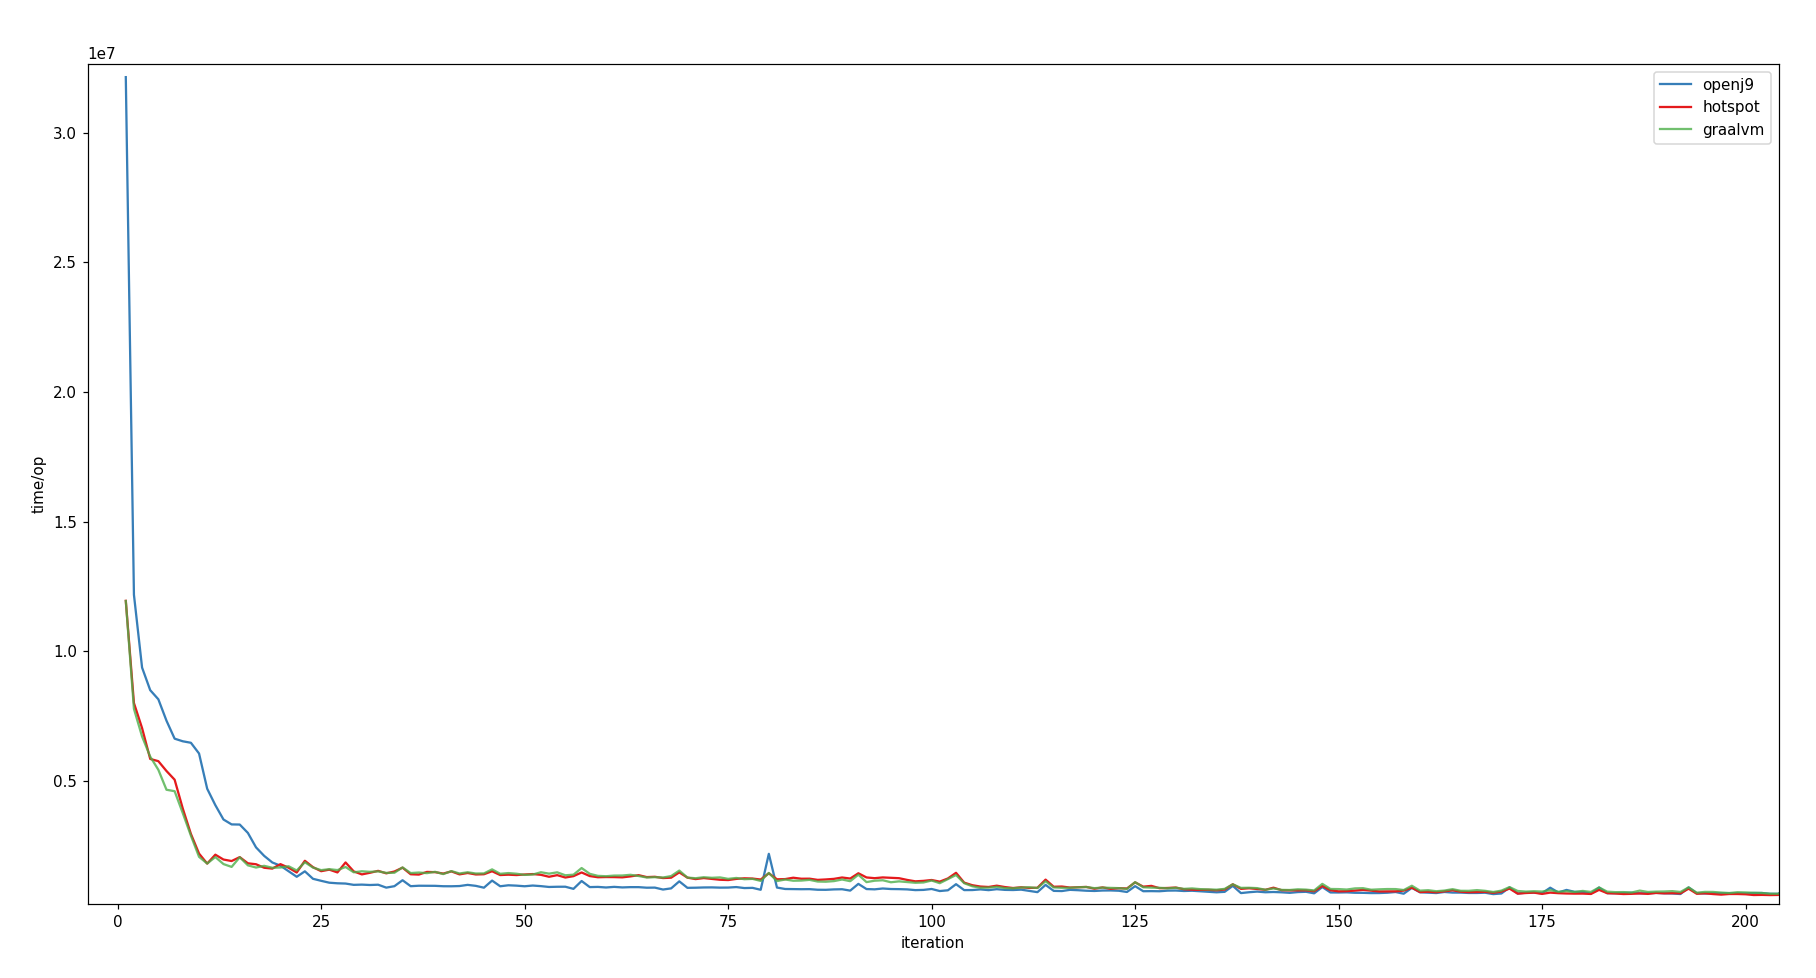
Unit: time/op in ns*107. Scatter shade omitted for visual clarity.
All three JVMs tend to reach their execution time plateau after approximately 200 to 300 subsequent iterations (HotSpot: approx. 0.4 ms/op, GraalVM: approx. 0.4 ms/op, OpenJ9: approx. 0.5 ms/op). From then on, a slight downward trend is still observable – although less significant than before.
While HotSpot's and GraalVM's warm-up graphs look quite similar and are able to reduce their execution time of the benchmark test down to 16.7% (from approx. 12 ms to 2 ms) after already approx. 10 iterations, OpenJ9 takes almost three times as long for the first iteration and only reaches the 2 ms line after approx. 20 iterations. From this point in time, OpenJ9 seems to perform a little better than its opponents until they get faster again beyond the 200 iterations mark [view chart].
The histogram chart provides visual information about the distribution of measured duration per benchmark test execution among all data points. The calculation of average execution times (means) is based on the same measurement data as the warm-up charts, minus the first 250 warm-up iterations. In order to remove outliers and produce clearer diagrams, data points before the 5% and beyond the 95% percentiles were cut off.
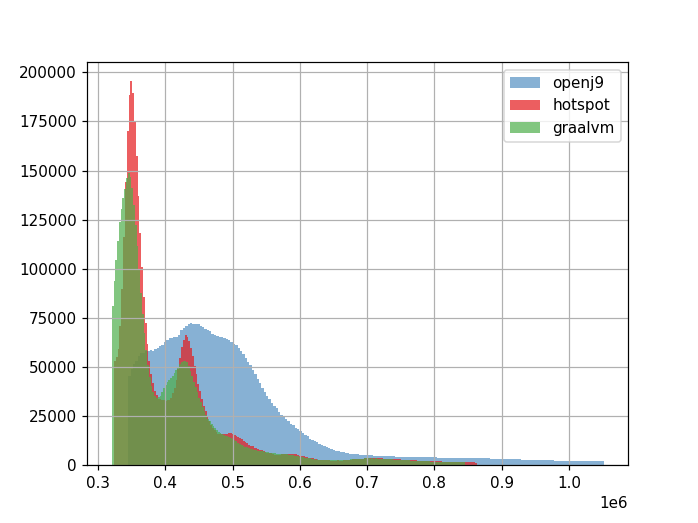
Units: x-axis: time/op in ns*106; y-axis: absolute number of occurrences.
The x-axis is labeled with the time per operation in nanoseconds (aggregated in 200 buckets) and the y-axis is a scale for the absolute number of datapoints per bucket.
While the graphs of HotSpot and GraalVM look quite similar, OpenJ9's average execution time graph describes a different curve.
HotSpot VM and GraalVM
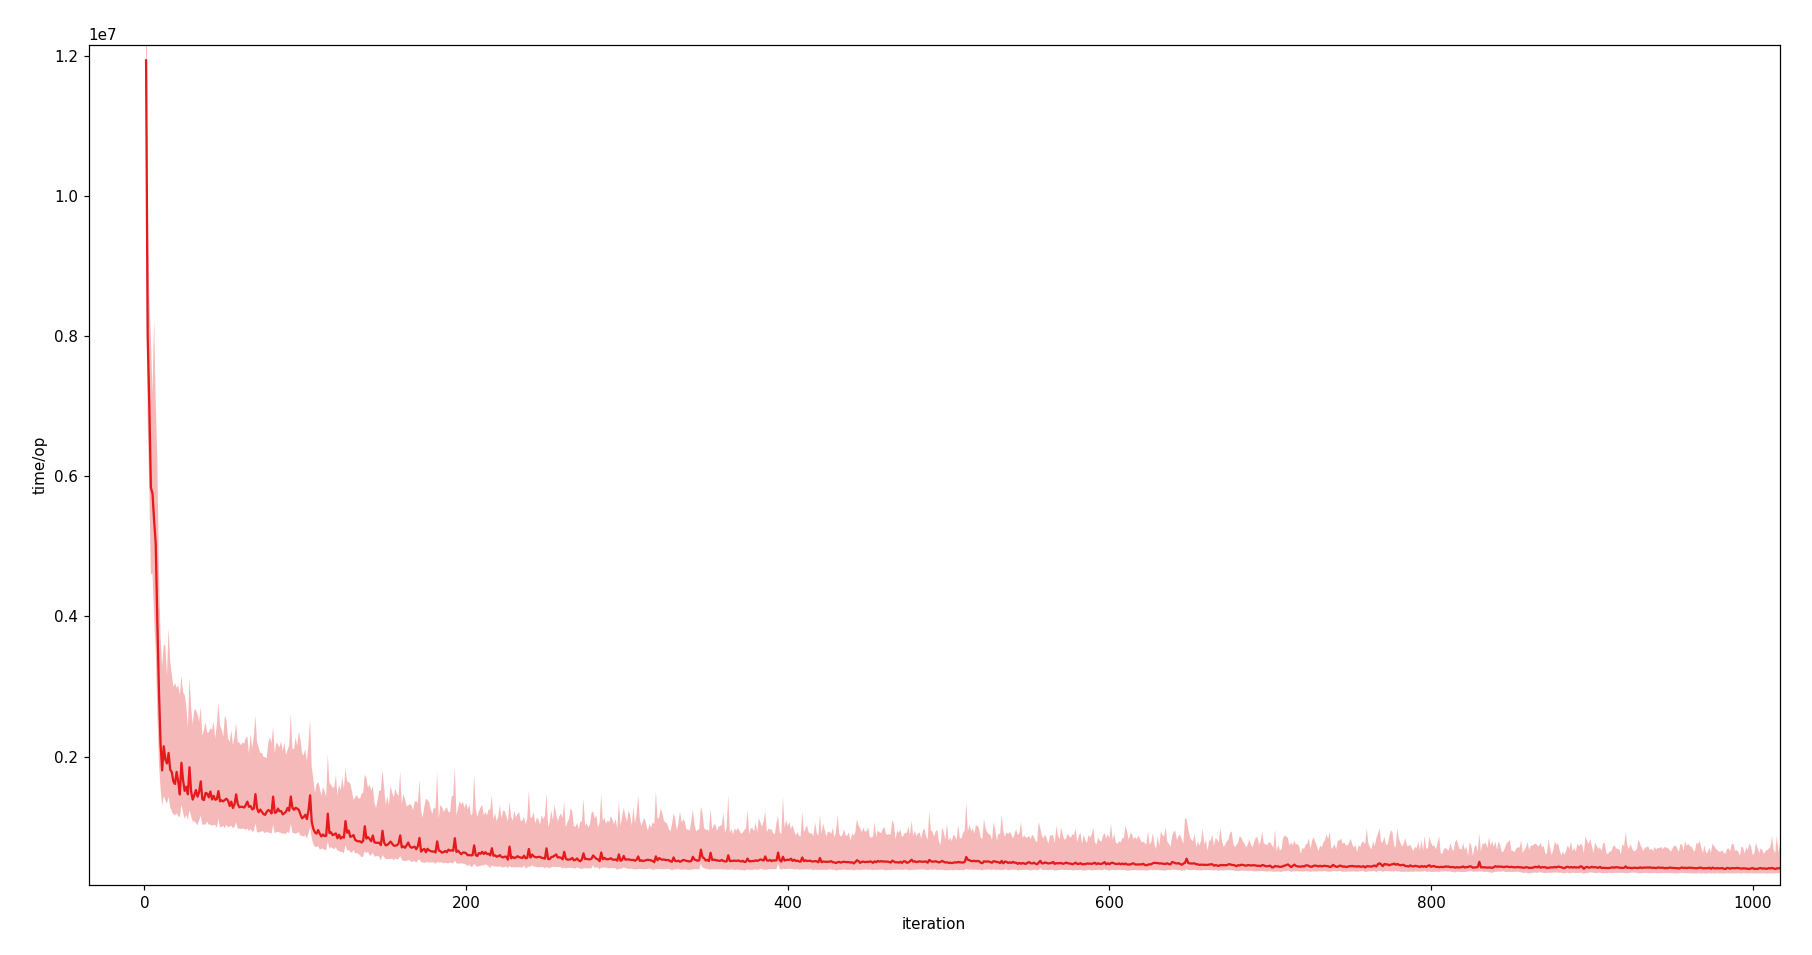
Unit: time/op in ns*107.
The light red coloured background of the warm-up graph shows its scatter shade. The shade is tightly following the median curve and also narrowing over the time. This shows that execution time is generally declining. The median curve is also showing a tendency to be in the lower bound of the interquartile range, which allows the conclusion that the data points between the median and Q3 are wider spread compared to the range from Q1 to the median.
This can also be observed in the warm-up charts of GraalVM and OpenJ9.
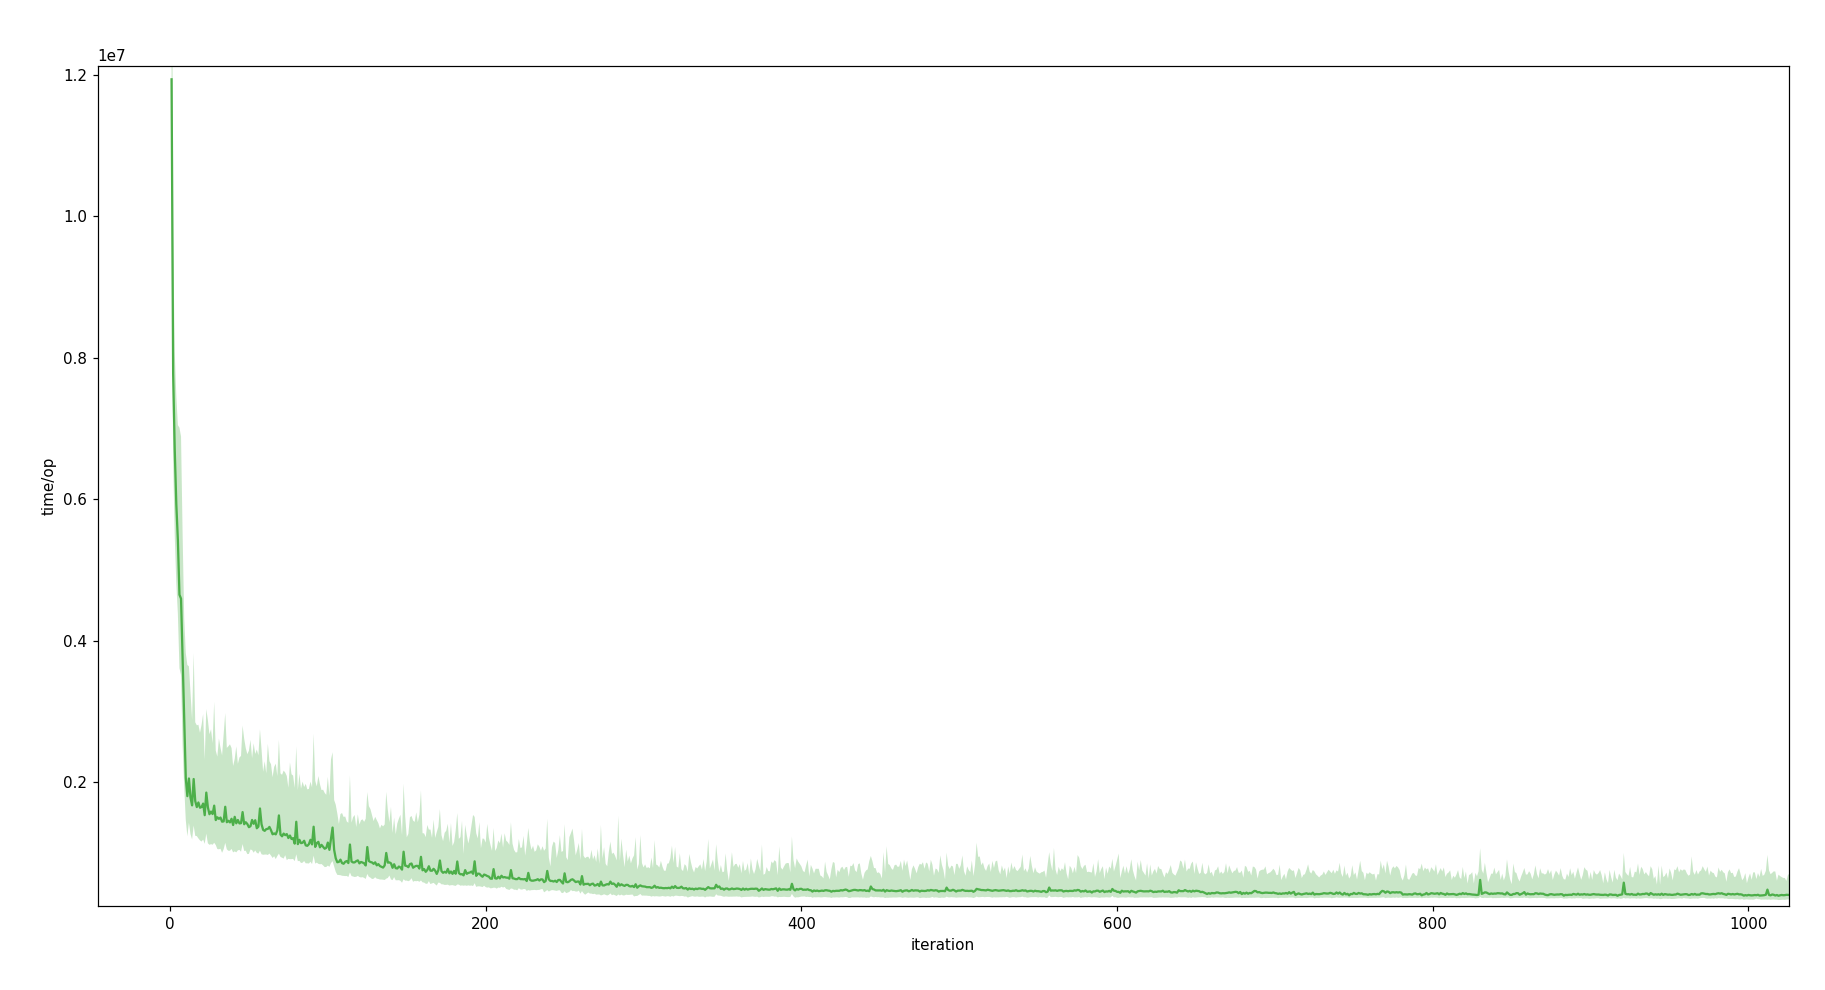
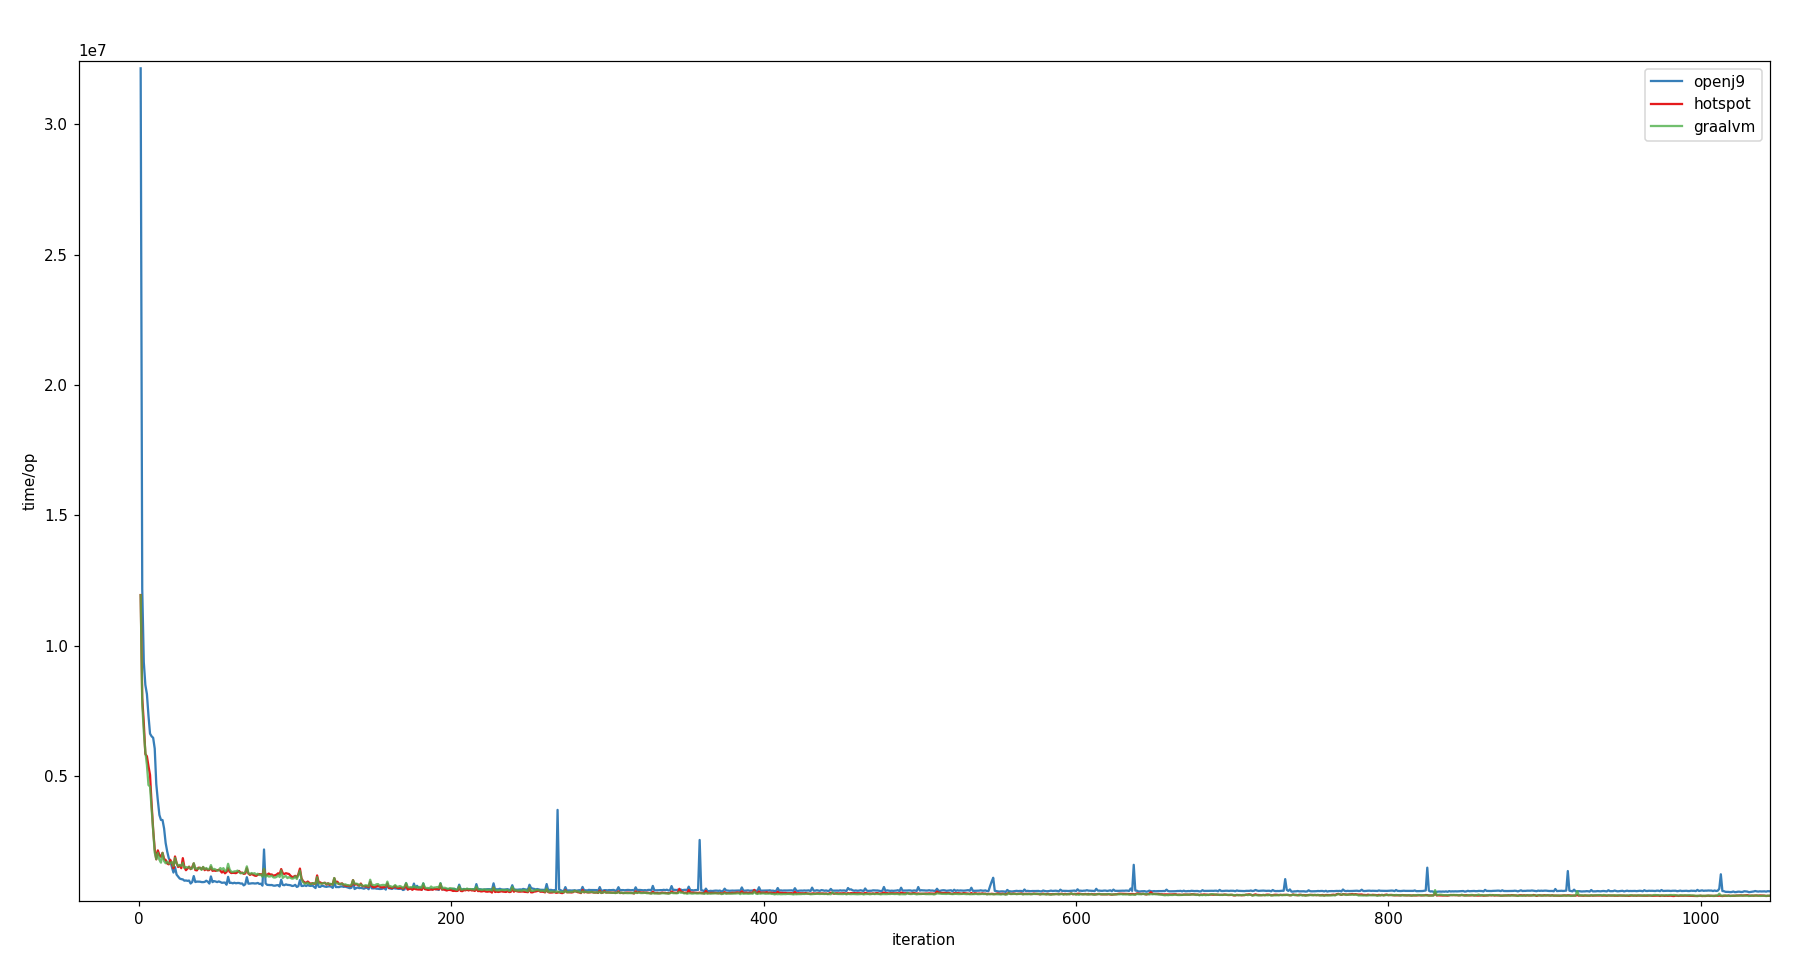
Unit: time/op in ns*107.
HotSpot and GraalVM show a sudden decline in the execution time shortly after iteration 100. Not only the median curve, but also the scatter shade describes a significant decline. The Q3 boundary starts to fall below the Q1 boundary of previous data points.
Between iteration 6 400 and 6 800 GraalVM shows a bump [view chart]. I did not dig into details here (I didn't have a good profiler at hand). However it would definitely be interesting to investigate this anomaly, especially since the warm-up curves of HotSpot and GraalVM share a lot of similarities, this bump marks a notable difference between them.
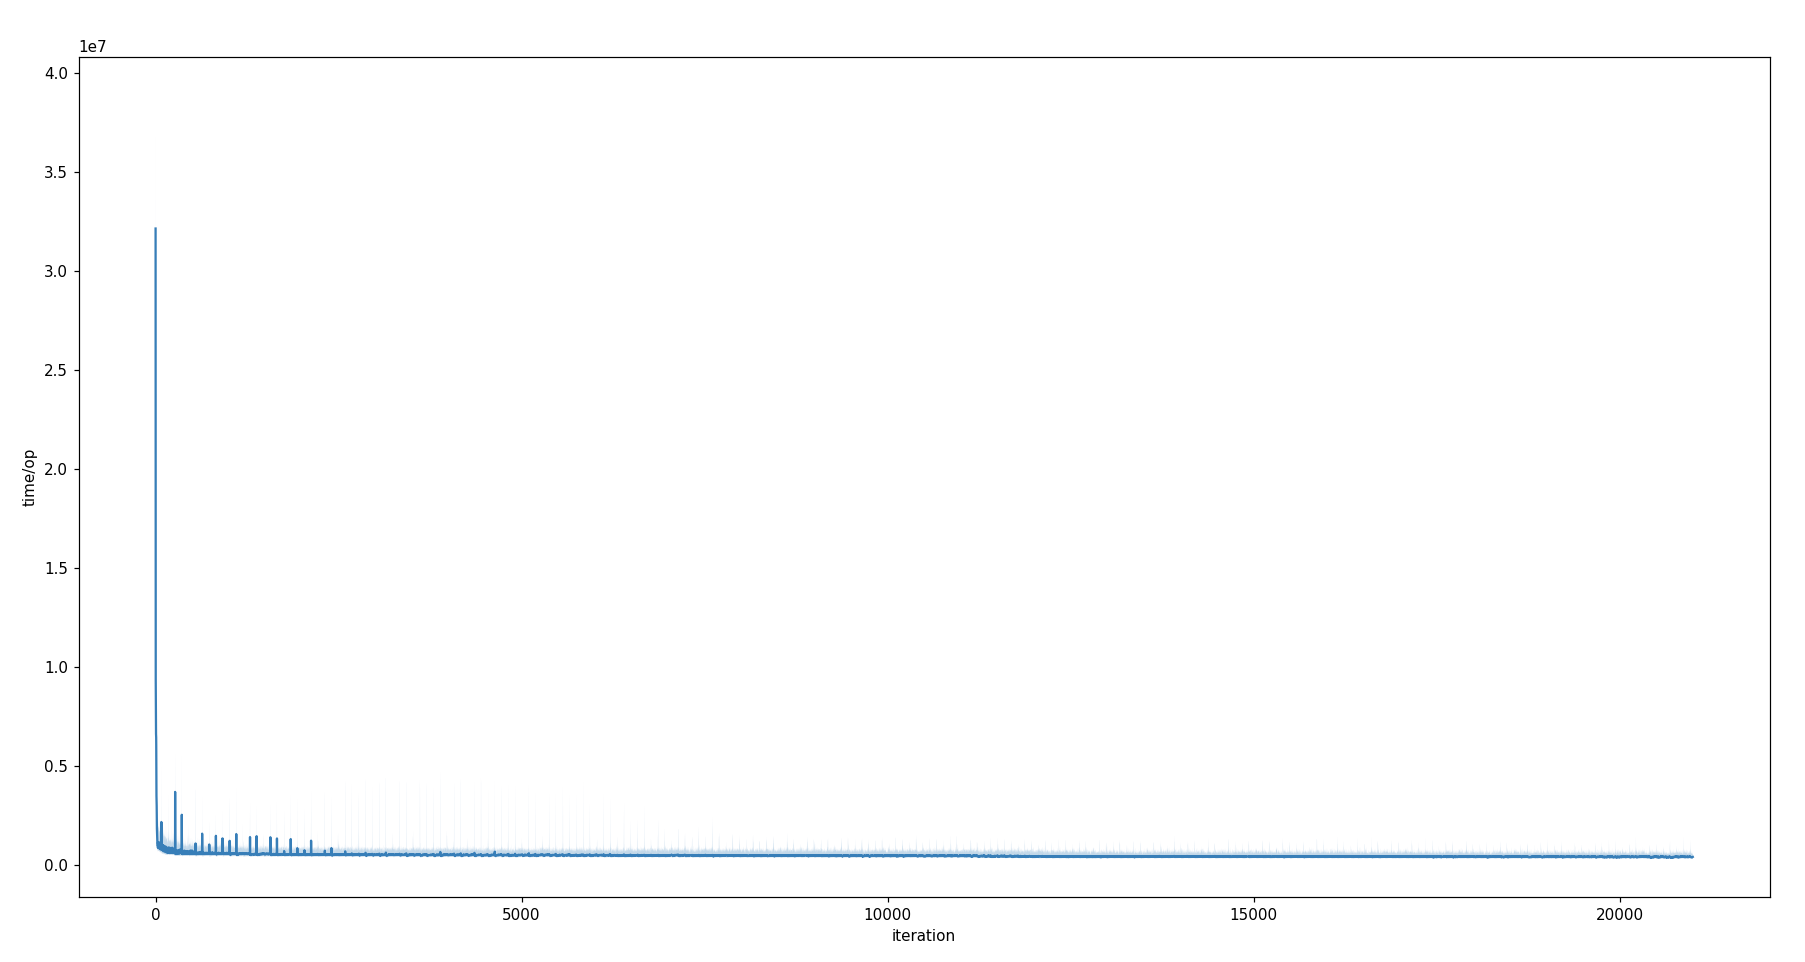
OpenJ9
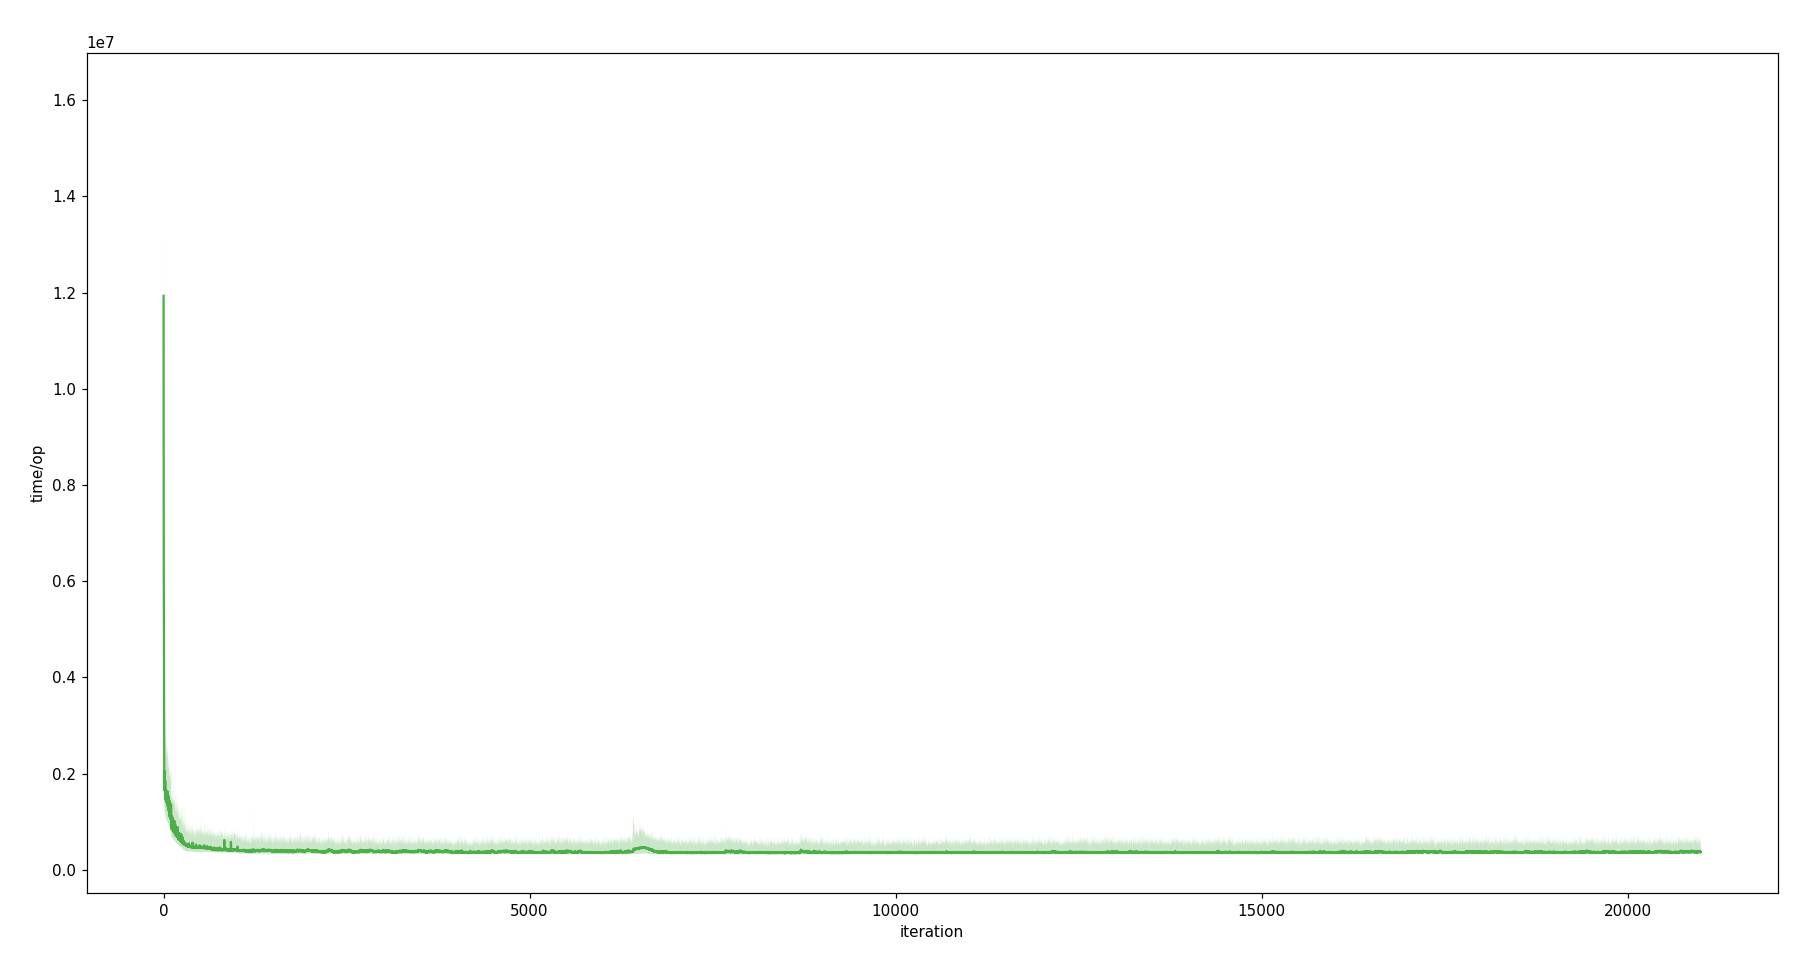
Unit: time/op in ns*107.
The warm-up chart of OpenJ9 looks somewhat different than the others. It does not show a sudden decline at the mark of 100 iterations. Instead it reveals some spikes in the execution time of single iterations, mostly among the first 2 500 iterations. After that, they become less outstanding. If the spikes could be attributed to the missing option for prefetching memory from the operating system, I would have expected to observe a similar behaviour for the other two JVMs, when the AlwaysPreTouch option was disabled. Therefore, I collected further measurement samples, but the data did not show any hints for the uttered suspicion. This leads to the conclusion that, in this test setup, fetching actual memory from the operating system had only minor or even no impact on the measurement series. The spikes in the warm-up graph of OpenJ9 cannot directly be attributed to fetching memory from the operating system.
OpenJ9 also has a much steeper negative slope over the first iterations compared to HotSpot or GraalVM. This suggests that the OpenJ9 JVM performs faster in method warm-up than the other two.
JITWatch
In order to gain some insights into JIT compiler optimizations that are applied on the benchmark code, I used JITWatch [12]. JITWatch is a log analyser and visualizer for JVM JIT compilers. It uses compiler logs in XML format which are created by the HotSpot VM and GraalVM when the following runtime flags are provided:
-XX:+UnlockDiagnosticVMOptions -XX:+TraceClassLoading -XX:+LogCompilation -XX:LogFile=jit-compilation.logFor OpenJ9 the seetings look like this:
-Xjit:count=0,verbose={compileEnd|inlining|compileTime},vlog=jitwatch-vlog
Loading the log file into JITWatch will show you the compilation timelines for your program's methods. Eight times, the HotSpot JIT compiler interacted with the
solve(int[][]) method of my Sudoku benchmark [view]. The compilation timelines do not necessarily depict all compilation events on the graph, but the information can also be retrieved from the compilation list [view].
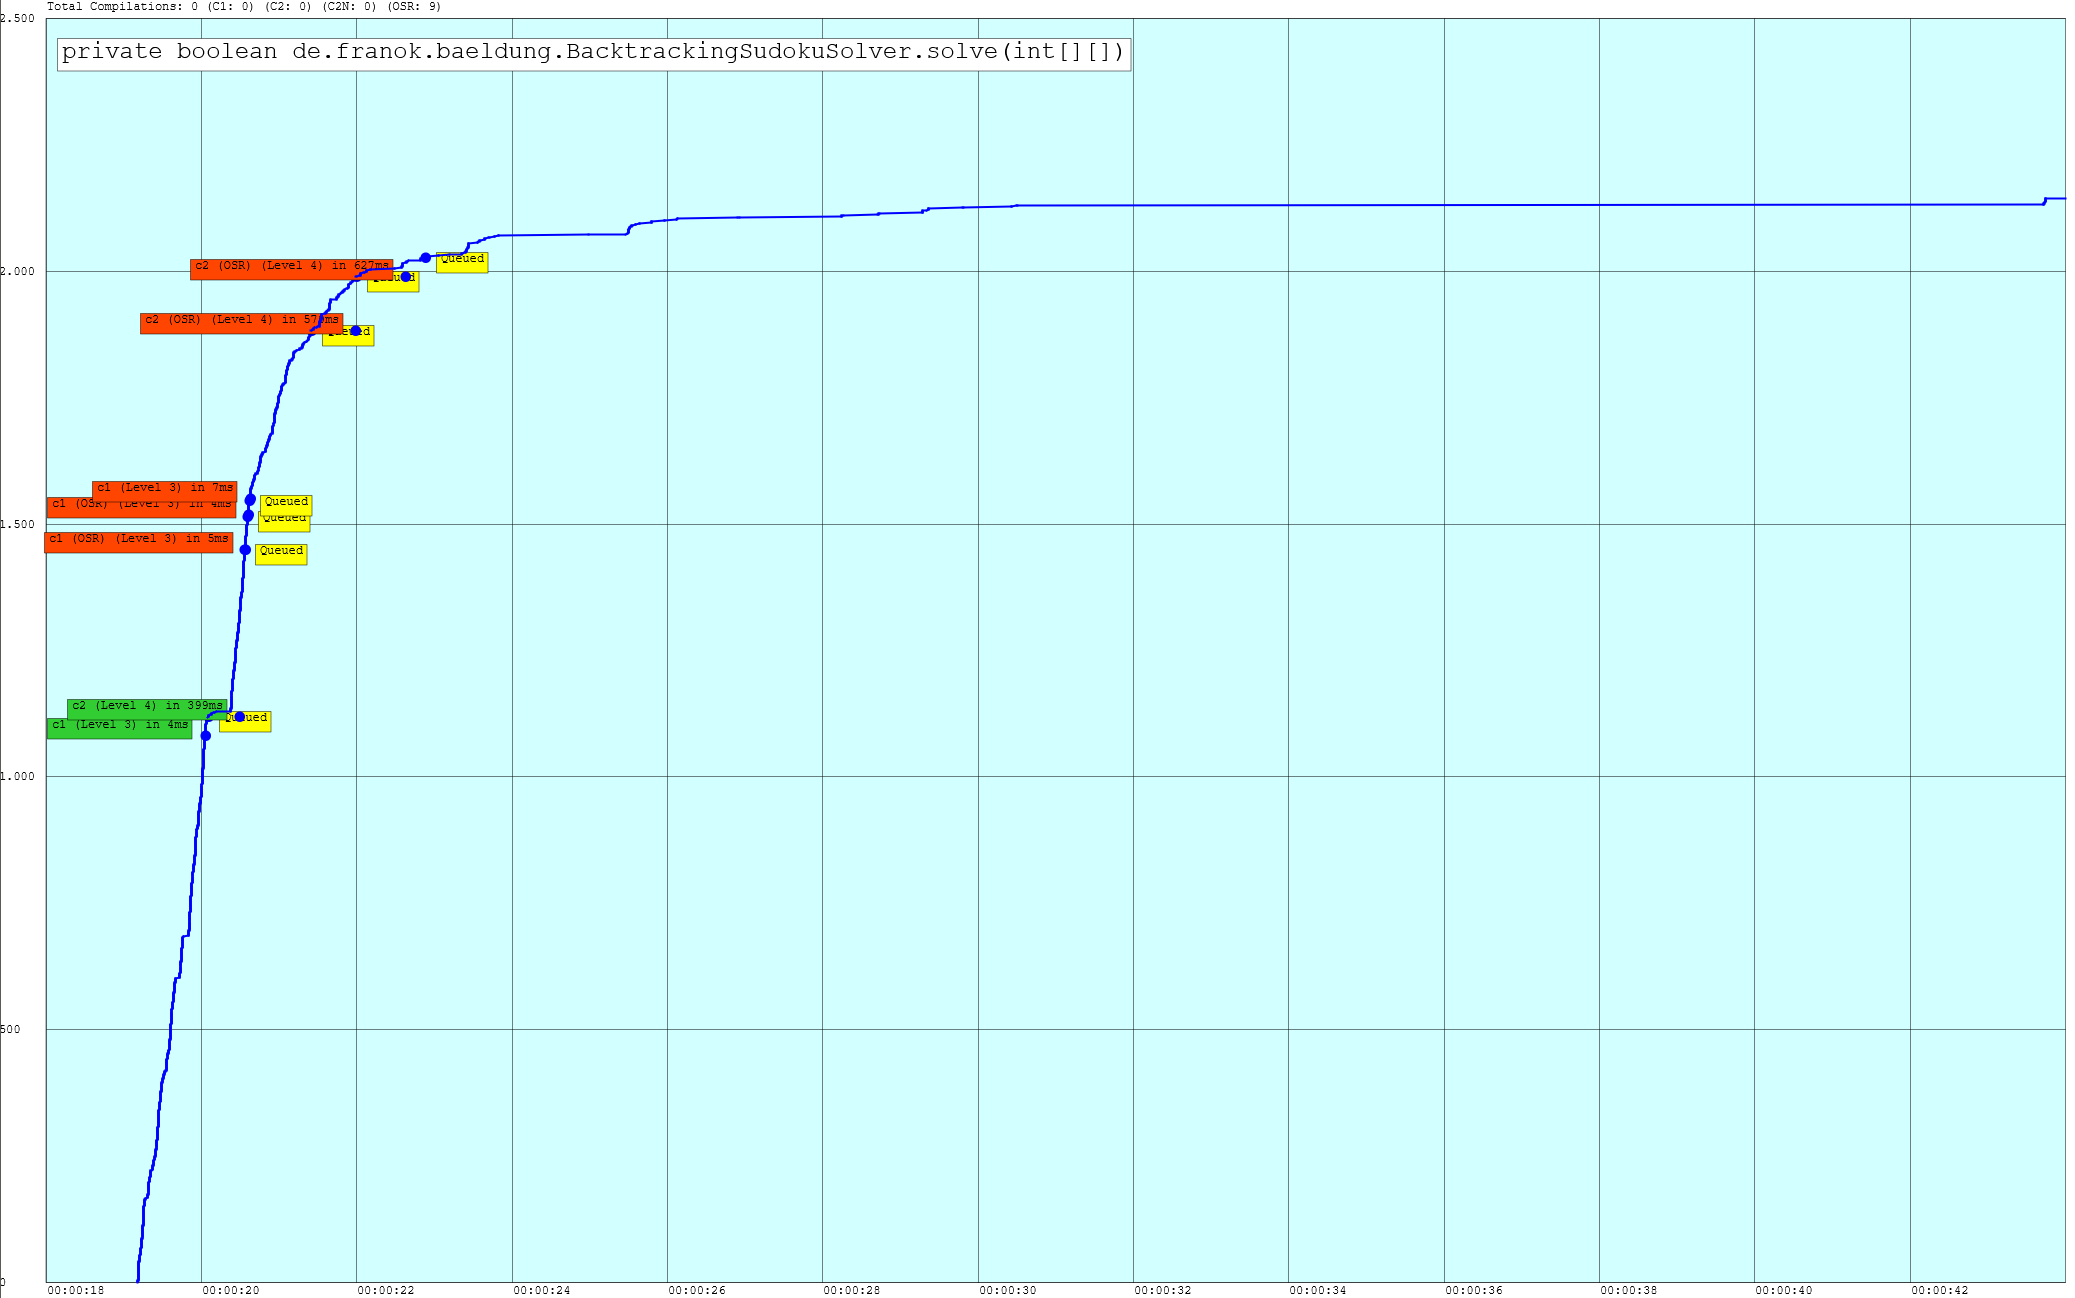
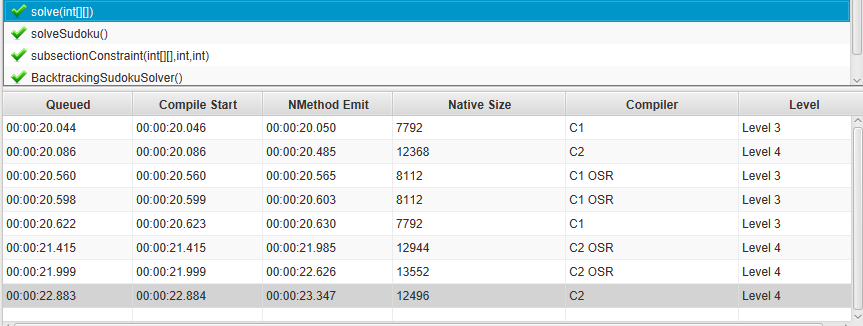
For those who are interested, I also link the respective compilation timelines and compilation lists for GraalVM [timeline, list] and OpenJ9 [timeline, list].
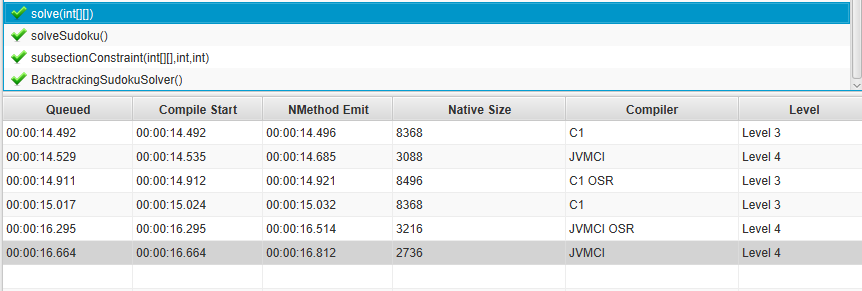
While JITWatch is a useful tool to visualize the actions of the JIT compiler, I encountered a discrepancy between the compilations shown by JITWatch and the JIT compiler actions logged to the terminal by providing the runtime flags -XX:+PrintCompilation -XX:+PrintInlining (having -XX:+UnlockDiagnosticVMOptions enabled). The terminal log output showed several inlining operations taking place already during the first iterations of the benchmark execution. These inlining operations also fit to the warm-up charts. The inlining operations probably are the main driver for the fast decline in the warm-up graphs right at the beginning of the measurements. The difference between the XML compilation log file used by JITWatch and the compilation log output on the terminal can be explained by the fact that there is a limitation in the -XX:+LogCompilation option which leads to the fact that inlining decisions made by the C1 compiler are not included in the XML log file. [13]
JIT vs. AOT
I also spent some CPU cycles on comparing the behaviour of AOT to JIT compiled code. I conducted this experiment with OpenJ9 since the AOT compiled code is still executed in a JVM. By contrast, GraalVM AOT compiled code would result in a native binary, which could not be benchmarked with JMH anymore.
In order to leverage the OpenJ9 AOT compiler, one must provide -Xshareclasses:nonpersistent,verboseAOT as an additional runtime flag. This enables class data sharing. The first time, the benchmark is executed, OpenJ9 compiles AOT code and stores it beyond the JVM life time. The next time, the benchmark code is executed, OpenJ9 will directly use the AOT compiled code.
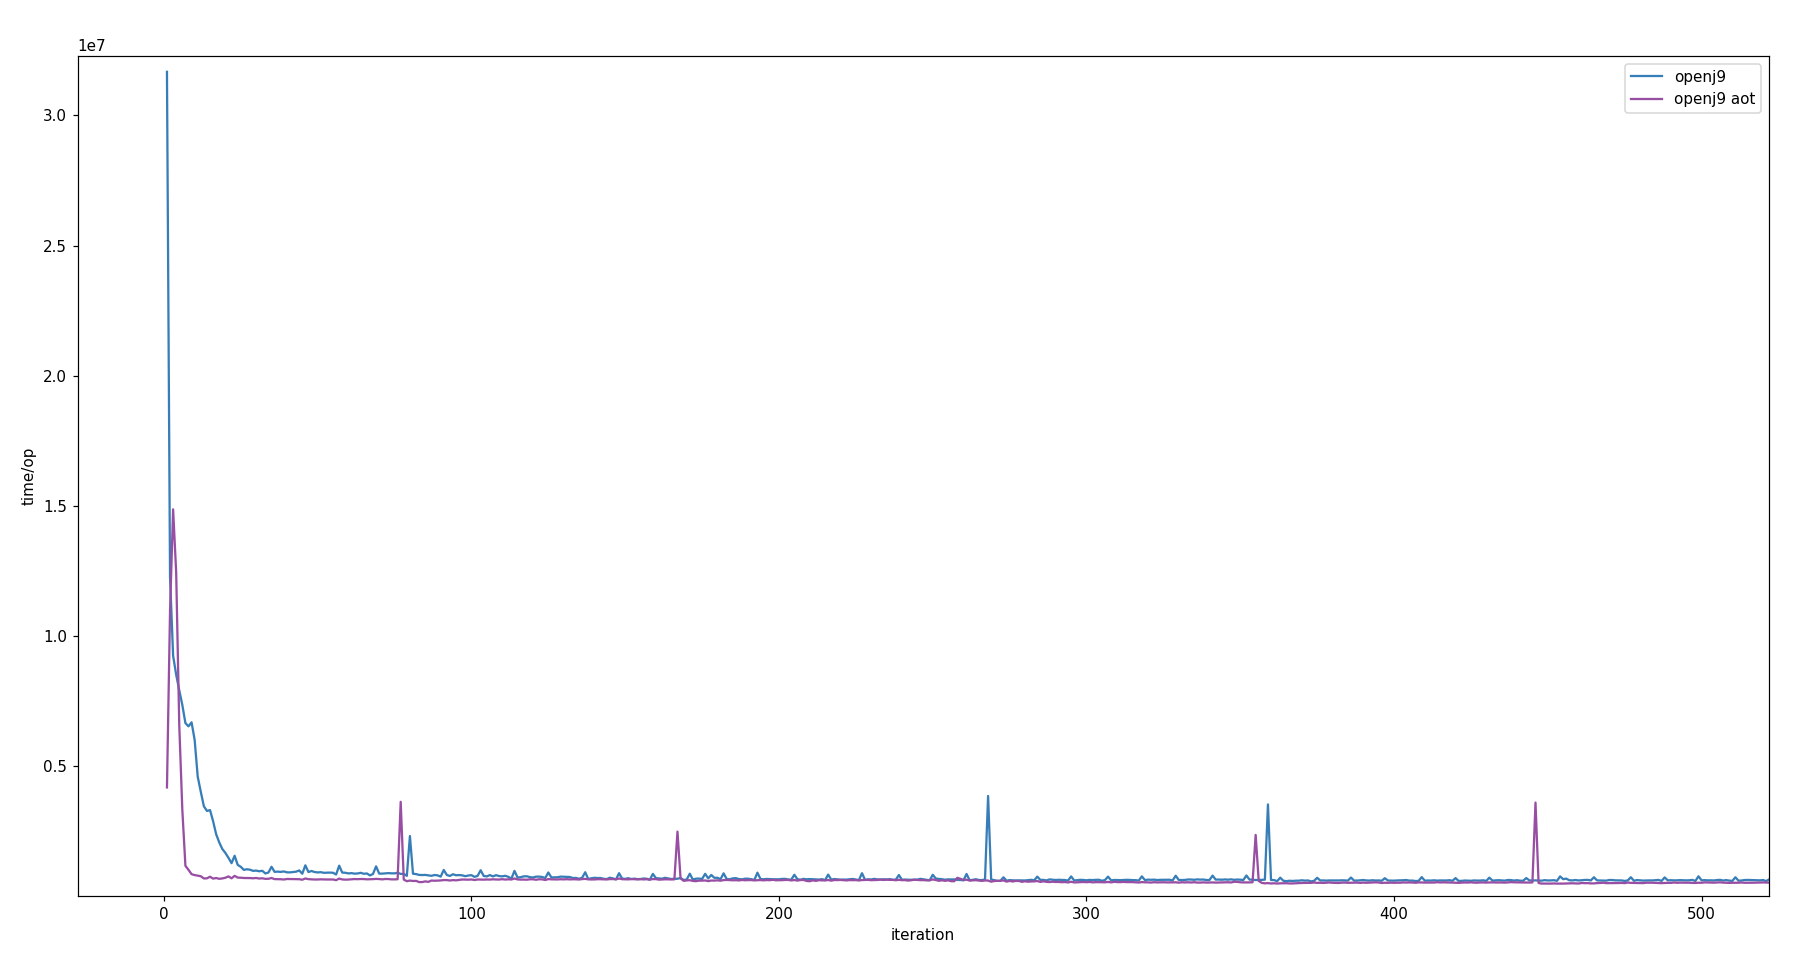
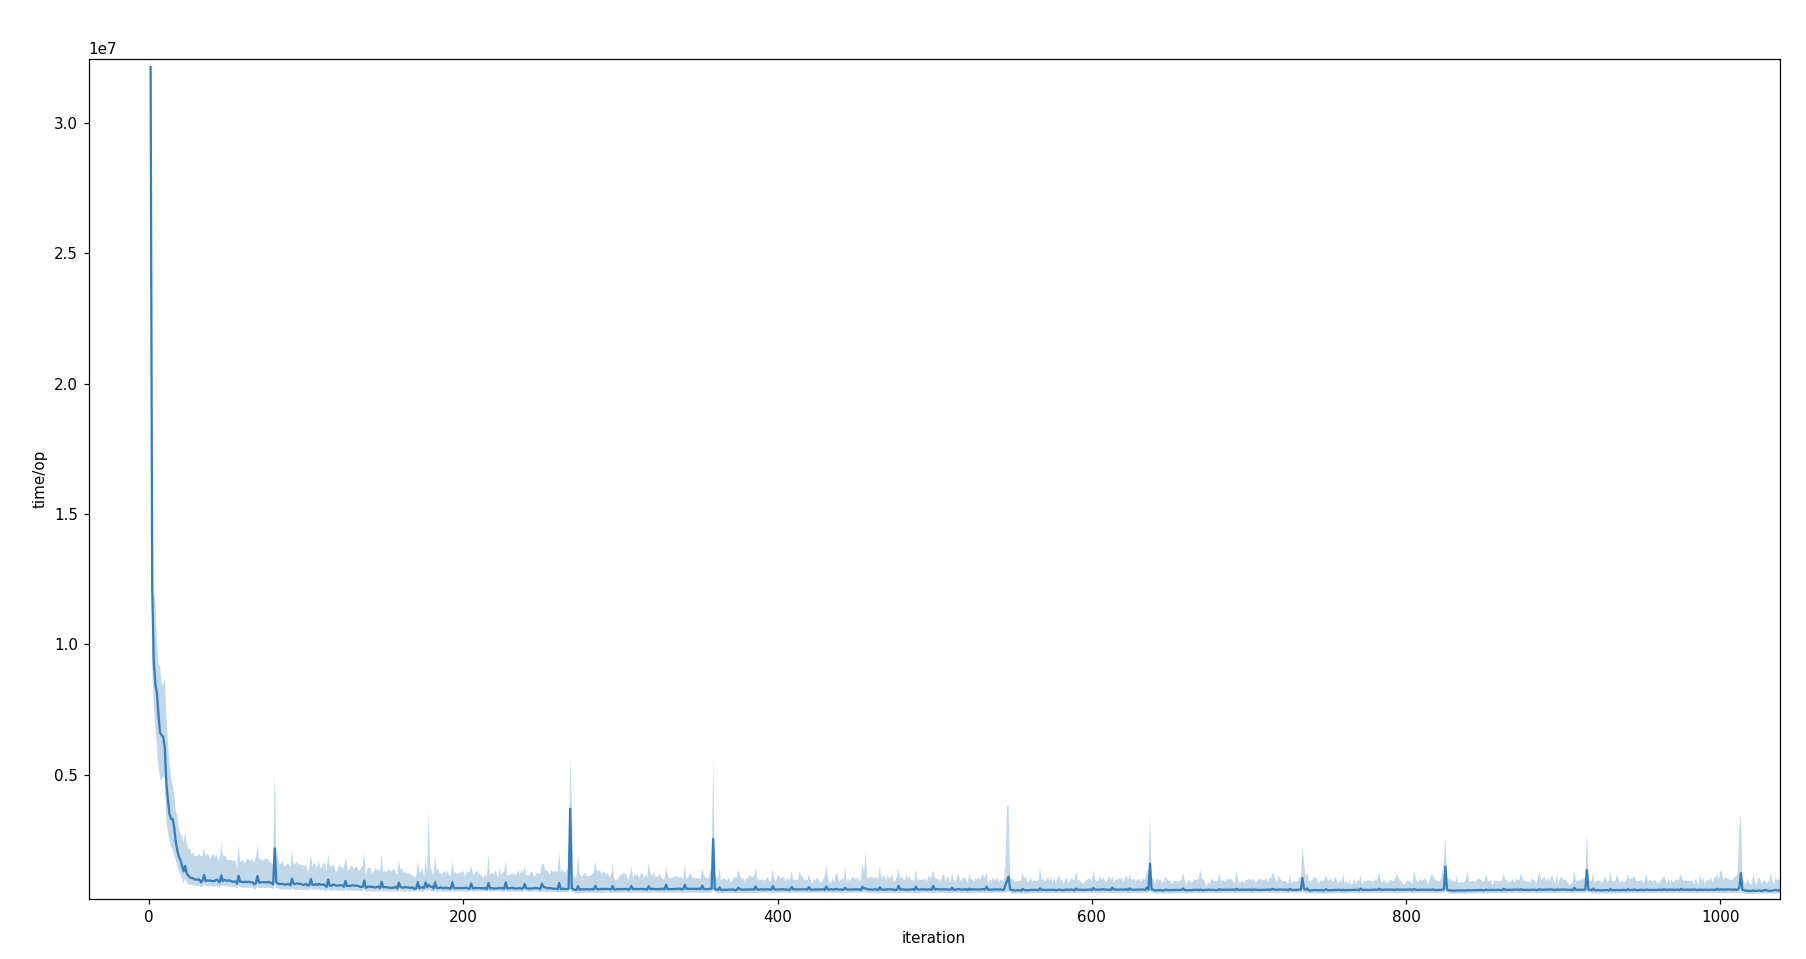
Unit: time/op in ns*107. Scatter shade omitted for visual clarity.
The purple curve is representing the data points from the AOT benchmark. The initial spike can most probably be attributed to loading the AOT compiled code. The logs provide evidence for this assumption. Compared to the JIT-based benchmark (blue curve) the AOT compiled code clearly performs faster, right from the beginning.
Also in comparison to HotSpot and GraalVM, OpenJ9 in AOT mode performs faster during the first iterations. However, the JIT compilers of HotSpot and GraalVM catch up with their opponent after approx. 250 iterations and clearly overtake it after approx. 700 iterations [view chart]. This kind of demonstrates that as long as the JVM with the JIT compiler is warming up, just interpreting bytecode, the JVM running AOT compiled code will perform faster. But as soon as the JIT compiler optimizations kick in, AOT code cannot really compete with the performance of JIT compiled code.
In average execution time OpenJ9 in AOT mode runs generally faster than in JIT mode [view chart]. In comparison to HotSpot and GraalVM it still lacks behind [view chart].
Let's sum it up: AOT compilation of Java code avoids the warm-up phase at the cost of not fully optimized code later on. Thus, it will always be an individual decision whether a Java program is executed with an AOT or JIT compiler.
Conclusion
▲This blog post got quite lengthy now. I hope you still found it an interesting read and maybe I inspired you to also get started with your own JVM research. Personally, I learned a lot during the last few months and I think my journey has just started. It feels like I've only scratched the tip of the iceberg. There's so much more to discover in the world of JVMs!
When benchmarking the AOT mode of OpenJ9 I wondered about the default configuration of the JVM. OpenJ9 advertises a performance advantage over HotSpot VM [14]. These performance gains come from making use of OpenJ9's AOT compilation and shared classes cache features. For me, this brought up the question why the features used in the advertised performance benchmarks are not enabled by default?
My study could only partially validate these advantages. On the one hand, the test scope of my study did not cover all KPIs listed on the OpenJ9 website. On the other hand my experiments were based on microbenchmarks, while the OpenJ9 project made its comparisons by a macrobenchmark. They ran the DayTrader7 benchmark using JMeter to perform a load test. So the test setups totally diverge from one another, making it impossible to falsify the performance statements on the OpenJ9 website.
It would have been my expectation that the Graal compiler makes the benchmark test being executed faster than HotSpot's C2 compiler would do. As shown in the JITWatch compilation timeline, the top level JIT compilers C2 and Graal were only activated after a few thousand iterations. At that point in time the level 4 compilations did not have a significant impact anymore, as lower tiers' compilations have already produced highly optimized code. Thus, HotSpot's and GraalVM's average execution times only differ by 5.5 μs. Another explanation for the similarity in their warm-up and average execution time results is probably, that GraalVM in version 20 still runs on the HotSpot VM and only adds the level 4 Graal compiler.
Recently, GraalVM 21.0 was released, with a JVM implementation named espresso which is fully written in Java (Java on Truffle). I'm curious to see this JVM's performance next to the GraalVM based on HotSpot VM. However, it seems like I have to wait a little for that, since the current raw performance of Java on Truffle isn't representative of what it will be capable of in the near future. The peak performance is several times lower than running the same code in the usual JIT mode. The warmup also hasn't been optimized yet.
[15] But the next minor releases promise to improve things there, step by step.
It also looks like Java on Truffle can bring the JIT compiler and the dynamic Java runtime to an ahead-of-time compiled binary.
[15] This makes me very excited about the future of this JVM's performance!
References
- [1] A keyword search on Google Scholar for »java jvm “warm-up|warmup”« between 2015 and 2020 returned 1 370 results (including duplicates).
- [2] Don't Get Caught in the Cold, Warm-up Your JVM (David Lion, et al. 2016. ISBN: 978-1-931971-33-1, pp. 383-400)
- [3] Book: Java Performance - The Definitive Guide (Scott Oaks, 2014. ISBN: 978-1-449-35845-7)
- [4] YouTube video: An Introduction to JVM Performance by Rafael Winterhalter
- [5] YouTube video: Everything I Ever Learned About JVM Performance Tuning at Twitter
- [6] HotSpot Virtual Machine Garbage Collection Tuning Guide [pp. 3-1 sq.]
- [7] JEP 318: Epsilon: A No-Op Garbage Collector
- [8] Deep Dive Into the New Java JIT Compiler - Graal
- [9] Java Microbenchmark Harness (JMH)
- [10] JMH Tutorial (Jenkov)
- [11] Donald E. Knuth: The Complexity of Songs
- [12] JITWatch
- [13] OpenJDK Wiki: LogCompilation overview
- [14] Eclipse OpenJ9 Performance Overview
- [15] Java on Truffle — Going Fully Metacircular
Appendix
Runtime flags (expand)
Charts (expand)
Data: JVM Benchmark Results
To the top ▲